Logbook window
The logbook window shows your log records line by line just as written in a conventional paper log. You can browse through your log up and down. Unlike a paper log, however, TurboLog 4 provides a multitude of powerful features for retrieving data compounds, sorting, reporting, maintenance, award tracking, etc., etc..
Following the analogy to a paper log the background color of the logbook window is white. In the following examples the window contains the last 15 logrecords in timely order....unless you instructed the log to be displayed in alphanumerical call order, for example. This operation is the effort of just one mouse click on the call caption....
The number of visible logrecords, however is self adjusting and depends on the size of TurboLog 4's main window frame. The size can be controlled by mouse-dragging the upper margin of the frame. Furthermore, available space for display also depends on the size of the lower packet action window. This window's size can also be adjusted by the user by mouse-dragging the upper margin of this sub frame. The maximum number of logrecords will of course be available at full screen operation of the main frame.
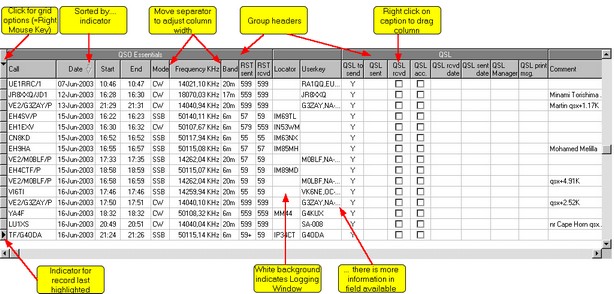
A typical configuration of the logbook window is depicted below:
Since the logging window can be customized there may be more columns with information off the right frame limit. This data can easily be inspected by dragging the horizontal slider that is available at the bottom of the frame to the right. Likewise the vertical slider that was designed at the right side of the window can be slit in order to scan the log manually. There are, however, more effective ways for navigating through the log as described further down.
The logbook window is characterized by the white background. The log records can be sorted by the following columns:
CALL
DATE
MODE
FREQUENCY
LOCATOR
USERKEY
QSL SENT
QSL RECEIVED
The sorting is always done in alphanumerical order. Sorry, there is no chance for a reasonable alphabetical sorting by the BAND field...at least not as long as it is defined in a user friendly notation. The sorting by frequency is the better choice. Sorting is very easy. You just need to click on the caption of one of the sort-fields as above. An arrow pointing downwards appears next to the caption and indicates the log being sorted by this field. The logging window's default sorting is by date ( and time ).
The following customization is available "on line":
•Clicking ( left mouse key ) on the vertical delimiter line between the captions starts the drag mode and allows you to adjust field widths.
•Clicking ( right mouse key ) on a caption results in displaying a thick black bar at the left side of the field. This indicates the drag mode for the whole column. It can now be moved wherever you want to.
If the field contains more information than currently being displayable because you limited the width of the field, there will be "..." indicating more data available if the field was wider.
Another feature we have introduced is the concept of "group headers". As demonstrated above these headers are well suited to maintain a logical order among the log fields. Currently there are two group headers:
•QSO Essentials and
•QSL.
Selecting a Range of Records:
First step:
| LEFT CLICK | ... into data grid in order to select it. Then: |
Next:
| SHIFT + LEFT KEY CLICK | Selects/highlights first log record (Likewise: CTRL + LEFT KEY CLICK ) |
| SHIFT + LEFT KEY | Selects last record for the range |
| CTRL + LEFT KEY | Allows to add separate records for the range |
If you want to select the complete grid:
| CTRL +A | Selects the complete grid ( All ) |
Bookmarks:
Please note the bookmark indicators which appear in the narrow leftmost column of all data grids. They indicate the following:
 Is the "normal" bookmark and shows the current database pointer.
 Indicates a selected database record and the current range limit if more than one record has been selected. A range limit can be selected by simultaneously pressing the Ctrl key and clicking the targeted record. (Likewise: CTRL + LEFT KEY CLICK )
 Denotes the second range limit for a number of records being selected. The second range limit can be set by simultaneously pressing the Shift key and clicking the targeted record.
 Denotes a member record of a selected range of records.
There are two ways of entering the Log Review Window:
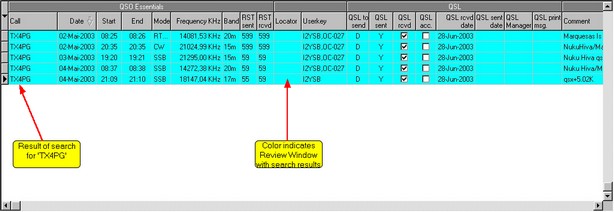
The first entry is from call/prefix analysis. If a call or a valid prefix was entered in the call field and Cursor+Down pressed the search string will be matched against all calls in the log and the resulting log records displayed in the Log Review Window.
Please note:
Pressing Tab will only step through the fields of the log input line.
The following picture is an example of a log search for 'TX4PG':
Please note the structure of the logrecords from the search. It is identical to the structure of the logbook window. The sky blue color, however, indicates the data grid being in review mode.
All search operations in TurboLog 4 related to the display of log records will yield outputs of the kind as above. The number of log records matching the search string is temporarily displayed on the status bar at the bottom of the screen
Clicking anywhere outside this window, e.g. into the loginput line will turn the data grid back into the logbook window.
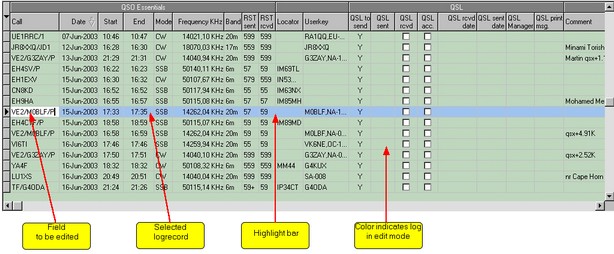
The second entry into the Log Review Window is from editing the log. While this Edit Mode is described in greater details in a separate paragraph the resulting window is depicted here for reasons of context:
The Log Review Window under Edit Mode is characterized by the background color "money green". Again, the data structure of the log records remains as in the Logbook Window. This illustrates the superiority of the data grid object and its powerful set of inherited properties.
CLICKABLES:
| LEFT KEY CLICK | Selects/highlights field or log record line |
| CTRL + LEFT KEY | Selects start range limit of log records to be selected |
| SHIFT + LEFT KEY | Selects second range limit of log records to be selected |
| RIGHT KEY CLICK | Activate pop up menu |
| CTRL +A | Selects the complete grid ( All ) |
This topic was last edited on Monday, 03-Jul-2023, at 23:57


