General Features:
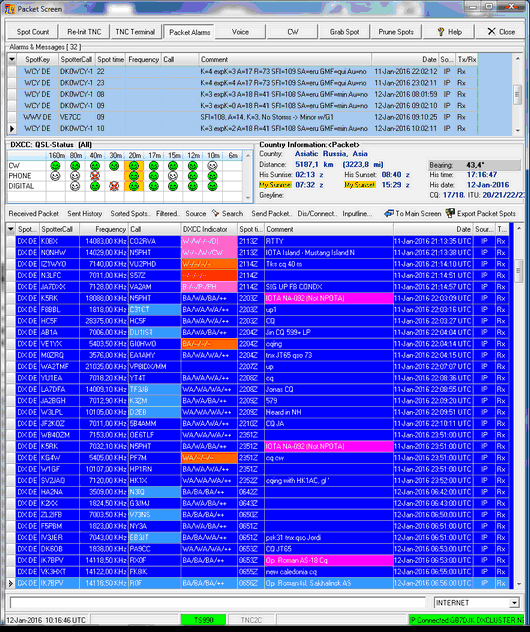
This screen is exclusively devoted to the Packet operations and intended to be in foreground while logging takes place only occasionally. The following is a screen shot of the Packet Screen. The Packet table shows spot highlighting for IOTA references in the Comment field, for Calls which have been worked before and the DXCC slot analysis in the DXCC Indicator Field:
The Packet screen is composed of the following frames:
•The Packet Control Panel
•The Country information Frame
•The DXCC Matrix
•The Alarms & Messages Frame
The referenced frames are common objects and used throughout TurboLog 4.
This frame is identical in all features to the one inserted in the lower part of the main logging screen. The only differences are:
•The input line is activated by default on the Packet Screen
•The TNC Terminal has been made available on the Packet Control Panel.
•All Call information directly controls the Country information frame.
Please note that one of the Comment fields is highlighted in the sample screen shot above. This is a result of the Packet Spot Highlighting facility. The example shows an IOTA-keyword being found in the Comment field. This turns this Packet spot into important information for the IOTA chaser.
The Country information Frame:
The only difference to the frame used on the main logging screen is that country information is derived from the call of the packet spot. This is indicated in brackets behind the caption of the frame.
This facility is described in a separate paragraph.
The Packet Control Panel, the Alarms and Messages Frame and DXCC Matrix are outlined in the following paragraphs.
Selecting a Range of Records:
First step:
| LEFT CLICK | ... into data grid in order to select it. Then: |
Next:
| SHIFT + LEFT KEY CLICK | Selects/highlights first log record (Likewise: CTRL + LEFT KEY CLICK ) |
| SHIFT + LEFT KEY | Selects last record for the range |
| CTRL + LEFT KEY | Allows to add separate records for the range |
If you want to select the complete grid:
| CTRL +A | Selects the complete grid ( All ) |
Bookmarks:
Please note the bookmark indicators which appear in the narrow leftmost column of all data grids. They indicate the following:
 The solid arrow head is the "normal" bookmark and shows the current database pointer.
 Indicates a selected database record and the current range limit if more than one record has been selected. A range limit can be selected by simultaneously pressing the Ctrl key and clicking the targeted record. (Likewise: CTRL + LEFT KEY CLICK )
 Denotes the second range limit for a number of records being selected. The second range limit can be set by simultaneously pressing the Shift key and clicking the targeted record.
 Denotes a member record of a selected range of records.
CLICKABLES:
| LEFT KEY CLICK | Selects/highlights field or log record line |
| CTRL + LEFT KEY | Selects start range limit of log records to be selected |
| SHIFT + LEFT KEY | Selects second range limit of log records to be selected |
| RIGHT KEY CLICK | Activate pop up menu |
| CTRL +A | Selects the complete grid ( All ) |
This topic was last edited on Thursday, 12-Dec-2024, at 13:30
